
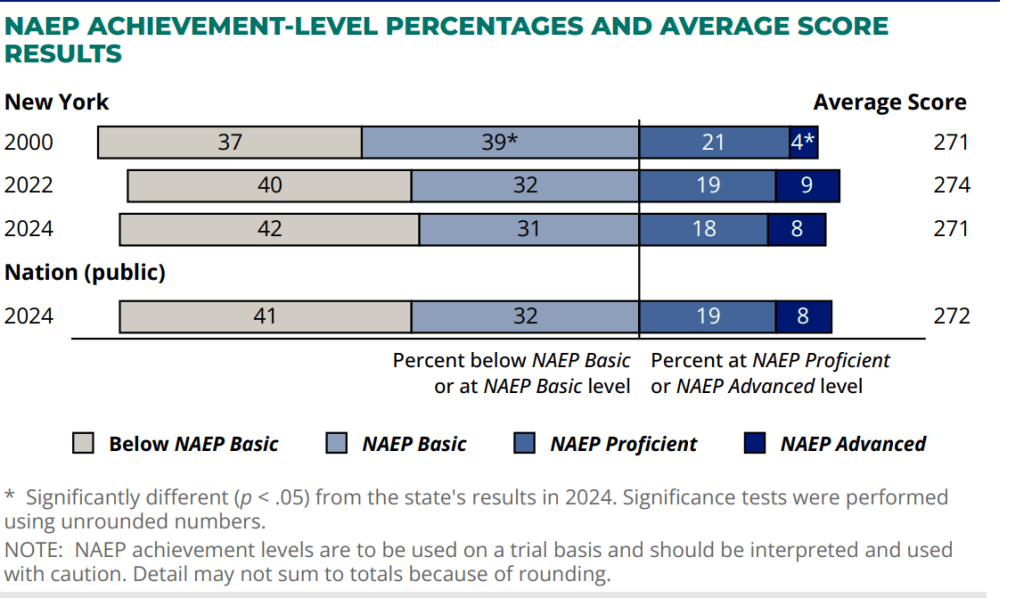
In my last post, I showed that New York’s Grade 8 math performance has declined over the last 8 years. According to the National Assessment of Educational Progress (NAEP), the average Grade 8 math score for New York public school students in 2024 was 271, with only 26% of students scoring at or above NAEP Proficient (NCES, 2024). While we are missing the Proficiency data from 2003 – 2019, the data shows that there has been an increase in students who are below Proficient from 2000 – 2024 while there has been an increase in students who are NAEP advanced.
Figure 1: Achievement-level percentages for New York Grade 8 mathematics in 2000, 2022, and 2024. Adapted from NAEP 2024 Mathematics: New York State Snapshot Report (NCES, 2024).
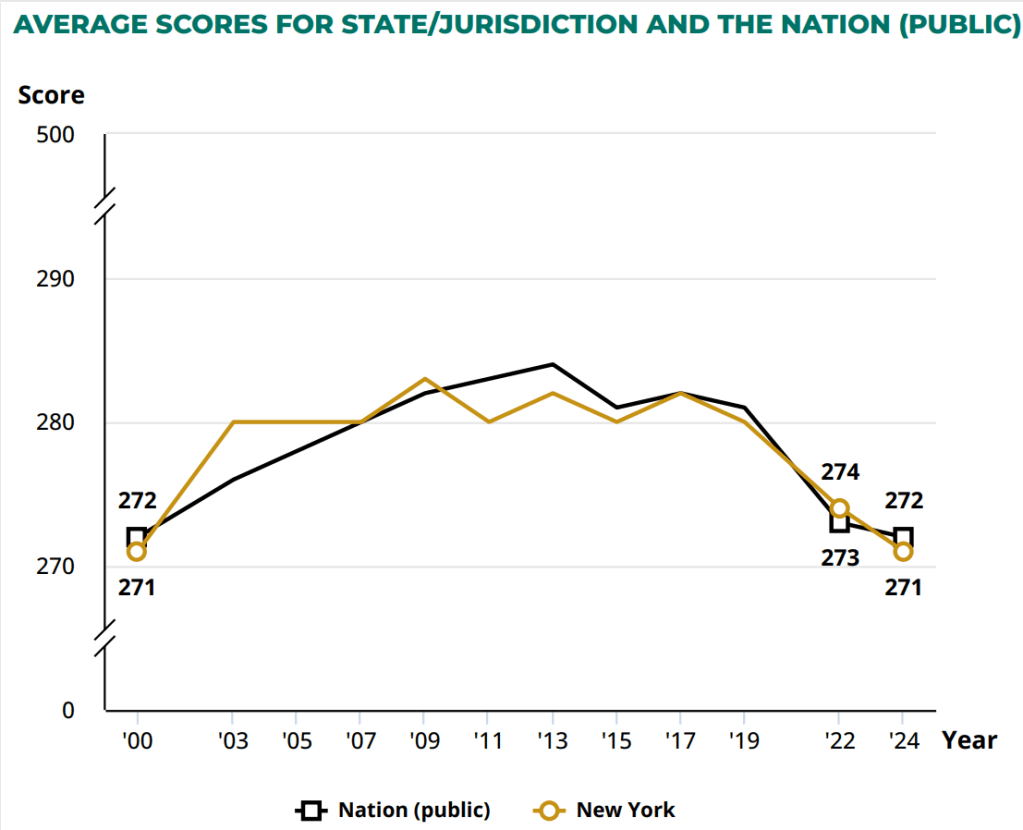
It is important to note that the trends of declining math performance are not a sole New York issue but reflective of national trends. However, in today’s current political climate, sound policy solutions must be created at the state level. Across the Nation, Math scores have been declining, but identifying and addressing these decreasing scores in New York will pave the way for other states to improve their outcomes as well.
Figure 2: Average scale scores for New York and the nation in Grade 8 mathematics from 2000 to 2024. Adapted from NAEP 2024 Mathematics: New York State Snapshot Report (NCES, 2024).
Below, I summarize several research-backed factors that are strongly associated with lower math achievement. These do not prove causation for New York’s NAEP pattern, but provide An evidence-based rationale for declining math achievement. What i found was that the problem with math Achievement extends far beyond learning loss due to covid, which has been a common culprit when referencing declining math scores. In subsequent blog posts, I will propose clear policy solutions to address each of these factors.
Teacher Shortages and Staffing Patterns Affect Math Instruction
One of the clearest national trends is the persistent shortage of qualified teachers—especially in math. The Learning Policy Institute estimates that 1 in 8 U.S. teaching positions is either vacant or filled by an underqualified teacher (Darling-Hammond et al., 2025). Mathematics consistently ranks among the hardest subjects to staff, alongside special education (Ingersoll et al., 2021).
New York is no exception. State officials project that the state will need over 180,000 new teachers in the next decade, with shortages concentrated in subjects like math and in high-need districts (New York State United Teachers, 2024). A state-commissioned analysis further found notable shortages by both subject area and district type (New York State Education Department, 2022).
Based on research by Ingersoll et al (2021), students taught by out-of-field or uncertified teachers have lower achievement, and this pattern is particularly strong in mathematics. Therefore, New York’s documented staffing challenges likely contribute to inconsistent and uneven math instruction, which should be especially true in districts serving high-need student populations.
Chronic Absenteeism Has Increased Dramatically
Absenteeism has surged across the country since the pandemic, and this trend holds true in New York as well. According to the New York State Comptroller, nearly 33% of students statewide were chronically absent in the 2022–23 school year, which is almost double the pre-pandemic rate. Its notable that these absenteeism Rates were even higher in high-need rural, suburban, and urban districts. In New York City, chronic absenteeism in high school reached 43.1% (DiNapoli, 2023). These trend aligns with concerns that the number of students who are below basic Proficiency on the NAEP. If teachers and schools aim to improve the Math Outcomes Of Students, Especially in High need districts, the students need to be in school.
Nationally, NAEP research shows a direct association between absenteeism and lower math scores. Based on their research, Students with higher absentee absences experienced larger NAEP math declines between 2019 and 2022 (NCES, 2023). additionally, using the same sample, Students who missed five or more days in the month before the NAEP scored substantially lower (Camera, 2022).
Therefore, I can conclude that Chronic absenteeism is strongly associated with weaker math performance, and New York’s sharp rise in absenteeism almost certainly contributes to its statewide decline in Grade 8 NAEP scores.
Pandemic-Era Learning Loss Hit Middle School Math Especially Hard
While I mentioned earlier than the Pandemic was not the only culprit causing declining math scores, it is true that the pandemic led to the largest math declines ever recorded on NAEP.
The 2022 Long-Term Trend Assessment found unprecedented declines in math for 9-year-olds, which was an early warning sign of widespread disruption in foundational learning (NCES, 2023b). With students losing foundational skills, they would have had to recover these math skills in upper grades. However, NWEA’s national analysis shows that math recovery has “stalled,” particularly for lower-performing and high-poverty students (Lewis et al., 2025). This stalling of math performance raises an equity concern, As A CALDER Study Found That Lower-Achieving Students Lost 0.10 Standard Deviations More In Math Than Higher-Achieving Peers During The Pandemic (Goldhaber Et Al., 2024). This learning loss had led to a Widening Math Achievement Gap, which can be seen in Figure 1. Compared to 2000, the overall NAEP Score Has Not Changed, But In 2024 There Were Increases In Both Students Below Proficiency And Those Showing Advanced proficiency.
This trend is explained by Middle school Math experiencing the deepest and most persistent learning loss due to the pandemic, with stalling recovery. This context has led to nationwide underperformance on the latest NAEP.
Structural Inequities are Shaping Opportunity
Figure 3. Average NAEP Grade 8 Mathematics Scale Scores for Economically Disadvantaged and Non-Economically Disadvantaged Students in New York, 2009–2024. Source: National Center for Education Statistics (NCES), The Nation’s Report Card Data Explorer.

the conditions under which students learn are shaped long before they sit for an assessment. This is seen most clearly when comparing the Grade 8 Math NAEP scores over the last 15 years. In 2009, economically disadvantaged students scored around 266, compared to nearly 294 for non-disadvantaged students, a gap of 28 points. By 2024, that divide actually increased, with disadvantaged students scoring 258 versus 289 for their more advantaged peers, While the data shows a 25–30 point spread between socioeconomic groups throughout the last 15 years, the gap has actually widened since the pandemic.
However, these results are not surprising, as it has been well documented for years that students in high-poverty districts routinely receive fewer resources, less access to certified math teachers, and less consistent instructional opportunities. When the nation is struggling with learning loss, absenteeism, and a teacher shortage, it is economically disadvantaged students who have been hit the hardest.
The Education Trust finds that districts serving the most students of color receive 16% less funding, and high-poverty districts nationwide receive 5% less than low-poverty districts (Baker et al., 2020). Within this context, the NAEP gap is a predictable result of structural inequities that shape opportunity long before students ever take an eighth-grade math assessment. Therefore, New York’s achievement gap is really an opportunity gap, which can be solved through intentional policy shifts across the state.
Closing
Based on available data from both new york and the nation, New York’s decline in Grade 8 math performance is due to compounding issues of teacher shortages, absenteeism, stalled learning gains, and structural inequities. However, None of these factors alone caused New York’s NAEP results alone and there may even be other factors causing regression in our students math performance.
However, by identifying potential culprits of math regression across the state, I will now be able to propose several policy solutions to solve each of these gaps. With effective policy creation and implementation, we can improve the learning outcomes for all of our new york students and move toward a brighter future.

Leave a comment